

Trend in three-year annual average PM2.5 concentration in Delhi
PM2.5 is fine particulate matter that is about 3% the diameter of human hair, and can lead to premature deaths from heart & lung diseases. There has been gradual decrease in all the 3 values – maximum, average and minimum of PM2.5 between 2015-2020.
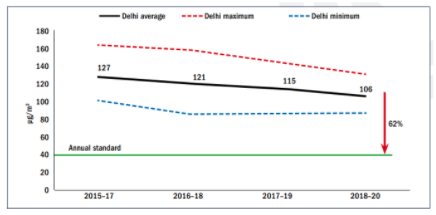
Note: Data from following CAAQM stations from where continuous data is available: Anand Vihar, CRRI Mathura Road, IGI Airport, IHBAS, ITO, Mandir Marg, NSIT Dwarka, North Campus DU, Punjabi Bagh, RK Puram, and Shadipur. Data up till 31 Dec 2020. Three-year averages are calculated using USEPA methodology and data completeness requirement, with median value substitution for missing data. Source: CSE analysis of CPCB’s real time data
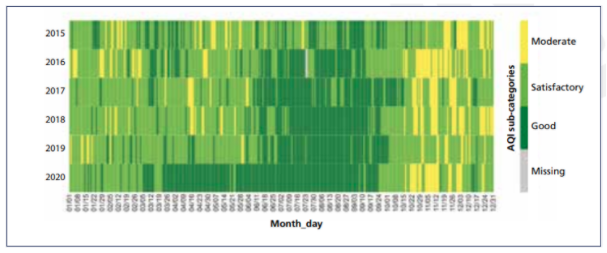
Heat Map of PM2.5 in Delhi from 2015 to 2020
The Heat Map of PM2.5 in Delhi shows a steady improvement in the air quality from 2015 through 2020, with the number of good and satisfactory days increasing significantly.
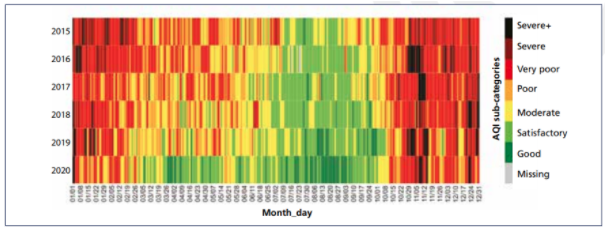
Note: CAAQM stations used were Anand Vihar, CRRI Mathura Road, IGI Airport, IHBAS, ITO, Mandir Marg, NSIT Dwarka, North Campus DU, Punjabi Bagh, RK Puram, and Shadipur. Source: CSE analysis of CPCB’s real time data
Heat Map of NO2 in Delhi from 2015 to 2020
The Heat Map of NO2 in Delhi shows a gradual but sure improvement from 2015 through 2020, as the concentration of dark green (Good) in the map increased into 2020.
Heat map of ozone exceedances in Delhi from 2015 to 2020
Heat map of Ozone exceedance in Delhi shows a gradual improvement from 2015 through 2020, as the concentration of green & blue (0 and 1 station) in the map increase and yellow and red (2, 3 and 4 stations) reduce, into 2020. Black and brown (5 and 6 stations) have almost disappeared by 2020.
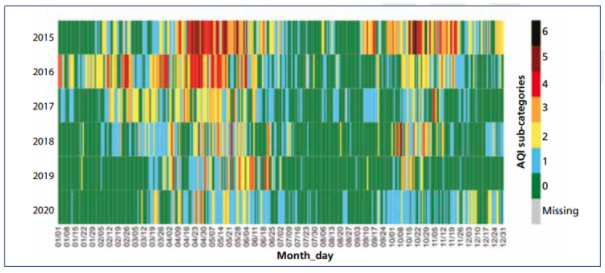
Note: Colours represent number of stations that exceeded the standard on that day, green being zero and black being six stations. Source: CSE analysis of CPCB’s real time data using USEPA methodology
Categorization of the number of days based on the AQI categories from 2017 to 2020
The number of Good, Satisfactory, and Moderate days per year (as per AQI categories) increased steeply from 42% to 80% between 2017 & 2020.
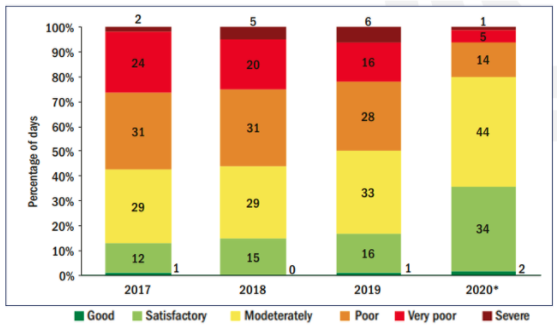
* Data for 2020 is considered till 01 September. Source: CSE’s analysis based on AQI bulletin published by CPCB daily
Categorization of the number of days based on the AQI categories from 2017 to 2019 for the winter period
Air quality In Delhi is the worst during winter. However, the number of Satisfactory and Moderate winter days per year (as per AQI categories) have increased from 6% to 16% between 2017 & 2019.
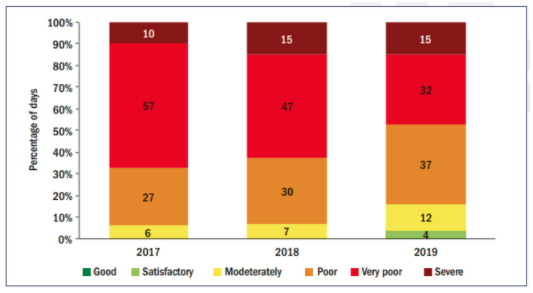
(Source: CSE’s analysis based on AQI bulletin published by CPCB daily)
Air Quality Monitoring
- All 26 ambient Air Quality Monitoring Stations were functional as of Dec 2020. (Status Report of Outcome Budget 2020-2021)
- 621 emission stack samples were tested in 2020-2021 by Dec 2020 against the target of 700. (Source: Status Report of Outcome Budget 2020-2021)
Air Quality Levels
As per Economic Survey of Delhi 2020-21, the annual average of ambient air quality levels of various pollutants have seen a decrease between 2014 and 2020.
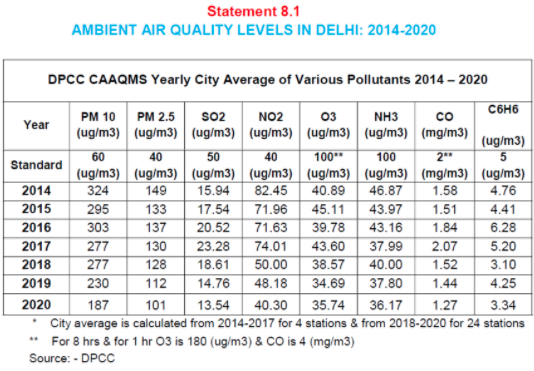
- Average annual concentrations of PM2.5, fine particulate matter, decreased from 149 microgram per cubic metre in 2014 to 101 microgram/cubic metre in 2020.
- Average annual concentrations of PM10, also decreased from 324 microgram per cubic metre in 2014 to 187 microgram/cubic metre in 2020.
- Average annual concentration of Nitrogen Dioxide has decreased from 82.45 microgram/cubic metre in 2014 to 40.30 microgram/cubic metre in 2020. The safe limit is 40 microgram/cubic metre.
- Average annual concentration of Carbon Monoxide has decreased from 1.58 mg/m3 in 2014 to 1.27 mg/m3 in 2020. The safe limit is 2 mg/m3.
- Annual city average for SO2 at all monitoring locations is within the prescribed standards of 50 microgram/cubic metre.
Transition to Electric Vehicles (EVs)
- 1747 beneficiaries received subsidies for battery-operated 2-wheelers in 2020-2021 till Dec 2020. (Source: Status Report of Outcome Budget 2020-2021)
- 771 beneficiaries received subsidies for battery-operated 4-wheelers in 2020-2021 till Dec 2020. (Source: Status Report of Outcome Budget 2020-2021)
- 95,353 eRickshaws registered. Subsidies offered on eRickshaws.
Tree planting and transplantation
- 3 lakh saplings were planted by ETF in 2020-2021 by Dec 2020 against the target of 2.5 lakh for the year. (Source: Status Report of Outcome Budget 2020-2021)
- 1.91 lakh saplings were planted outside the sanctuary in 2020-2021 by Dec 2020 against the target of 1.93 lakh for the year. (Source: Status Report of Outcome Budget 2020-2021)
- 3.88 lakh seedlings were distributed for free in 2020-2021 by Dec 2020 against the target of 3.5 lakh for the year. (Source: Status Report of Outcome Budget 2020-2021)
- 5 city forests have been created and maintained upto Dec 2020 against the target of 5 in 2020-2021.(Source: Status Report of Outcome Budget 2020-2021)
Increase in public transport ridership during the odd-even scheme in Delhi
Average daily ridership of DTC Bus & Metro increased during the Odd-Even phase-1.
Also, a minor marginal increase in the Net ridership after the end of Odd-Even shows that some commuters may have shifted to public transport, thereby reducing private vehicles on Delhi roads.
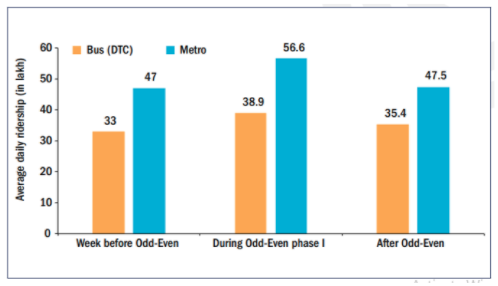
(Source: DTC, DMRC)
PM emissions from different segments of commercial vehicles
Estimated PM emissions per day from goods carriers surveyed in 2015 and 2019 show a significantly drop.
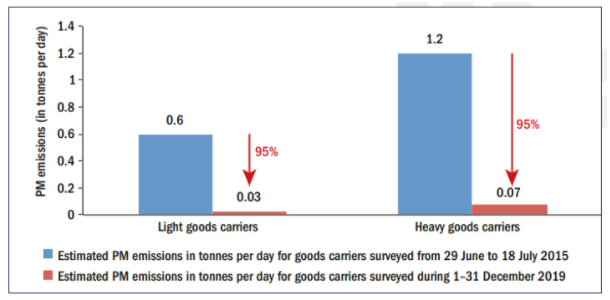
(Source: SAFAR study from 2018, CPCB study titled Status of Pollution Generated from Road Transport in Six Mega Cities from 2015, and CSE commissioned survey data of June–July 2015)
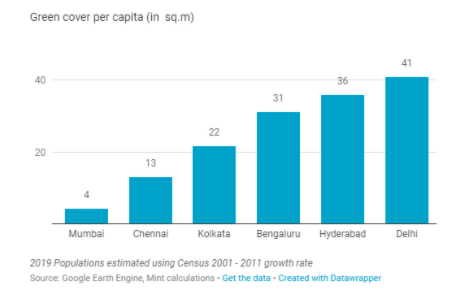
Green Cover
- Delhi’s green cover has increased from 21.88% to 23.06% of its geographical area in the last two years, according to the Jan 2022 “India State of Forest Report (ISFR)” released by the Union Environment Ministry.
- Delhi’s tree cover increased from 129 square km in 2019 to 147 square km. The overall green cover (forest cover and tree cover) increased from 324.44 sq km to 342 sq km.
- Delhi has the highest green cover per capita among all 6 metros as of Oct 2019.